
2. Base year demand#
TIMES-NZ models residential demand across different regions, and also across different dwelling types (joined/detached), as these have different energy demand profiles. We disaggregate the EEUD demand data across regions and dwelling types to model residential demand in more detail. This input disaggregation is based on modelling done for TIMES-NZ 2.0 and at the University of Otago[1]. At a high level, energy demand is disaggregated by:
a) Population and dwelling type data per region from Census 2023 b) Known fuel availability (South Island regions do not have access to natural gas) c) Census 2023 responses on dwelling heating methods per region and dwelling type d) Typical meteorological year Heating-degree days per region
These methods are detailed further below. The resulting residential demand model is designed per regional council area. However, TIMES-NZ currently only models each island, so this is aggregated to demand per island for use in the model itself. The full regional results are made available separately.
2.1. Regional space heating model#
To model where space heating technologies and fuels from the EEUD[2] are used, we distribute known fuel demand using:
Census 2023 data on heating methods per region and dwelling type[3]
Census 2023 data on population per region and dwelling type
Assumptions on floor area per dwelling type
Heating-degree days, or heat demand per region in a typical meteorological year
Technology efficiency assumptions
We align with the method used for TIMES 2.0 and “Regional breakdown of New Zealand’s residential heat demand and associated emissions”[1], while simplifying slightly to model demand at a regional council level, rather than by district.
2.1.1. Step 1: Model total heat demand for each region and dwelling type#
Equation (3): Heat demand for each region and dwelling type
Where:
\(HeatDemand_{r,d}\) is the residential space heating demand in each region \(r\) and dwelling type \(d\).
\(FloorArea_{r,d}\) is the residential dwelling floor area in each region \(r\) and dwelling type \(d\).
\(HDD\) are the heating-degree days[4] for the region \(r\). We use the same assumptions on regional heating-degree days as TIMES 2.0. These are based on a typical meteorological year.
\(C\) is a constant which captures other drivers of a region’s heating demand, such as insulation properties or behavioural differences. We assume that these other drivers are the same between regions.
Floor area assumptions are 171 m2 for detached dwellings, and 115 m2 for joined dwellings.
2.1.2. Step 2: Disaggregate floor area heat demand by heating methods#
Equation (4): Floor area heating demand
We expand the floor area method of determining heat demand by breaking it down by share of heating method.
Where \(HeatingTypeShare_{r,d,h}\) is the share of heating method \(h\) used in dwelling type \(d\) and region \(r\).
Heating method shares can be found using Census 2023 data[3]. The census respondents could provide multiple answers, but it is not possible to distinguish dwellings using multiple heating methods. We therefore simplify the results to estimate shares of heating method per region and dwelling type. The resulting heating shares are detailed in Fig. 1.
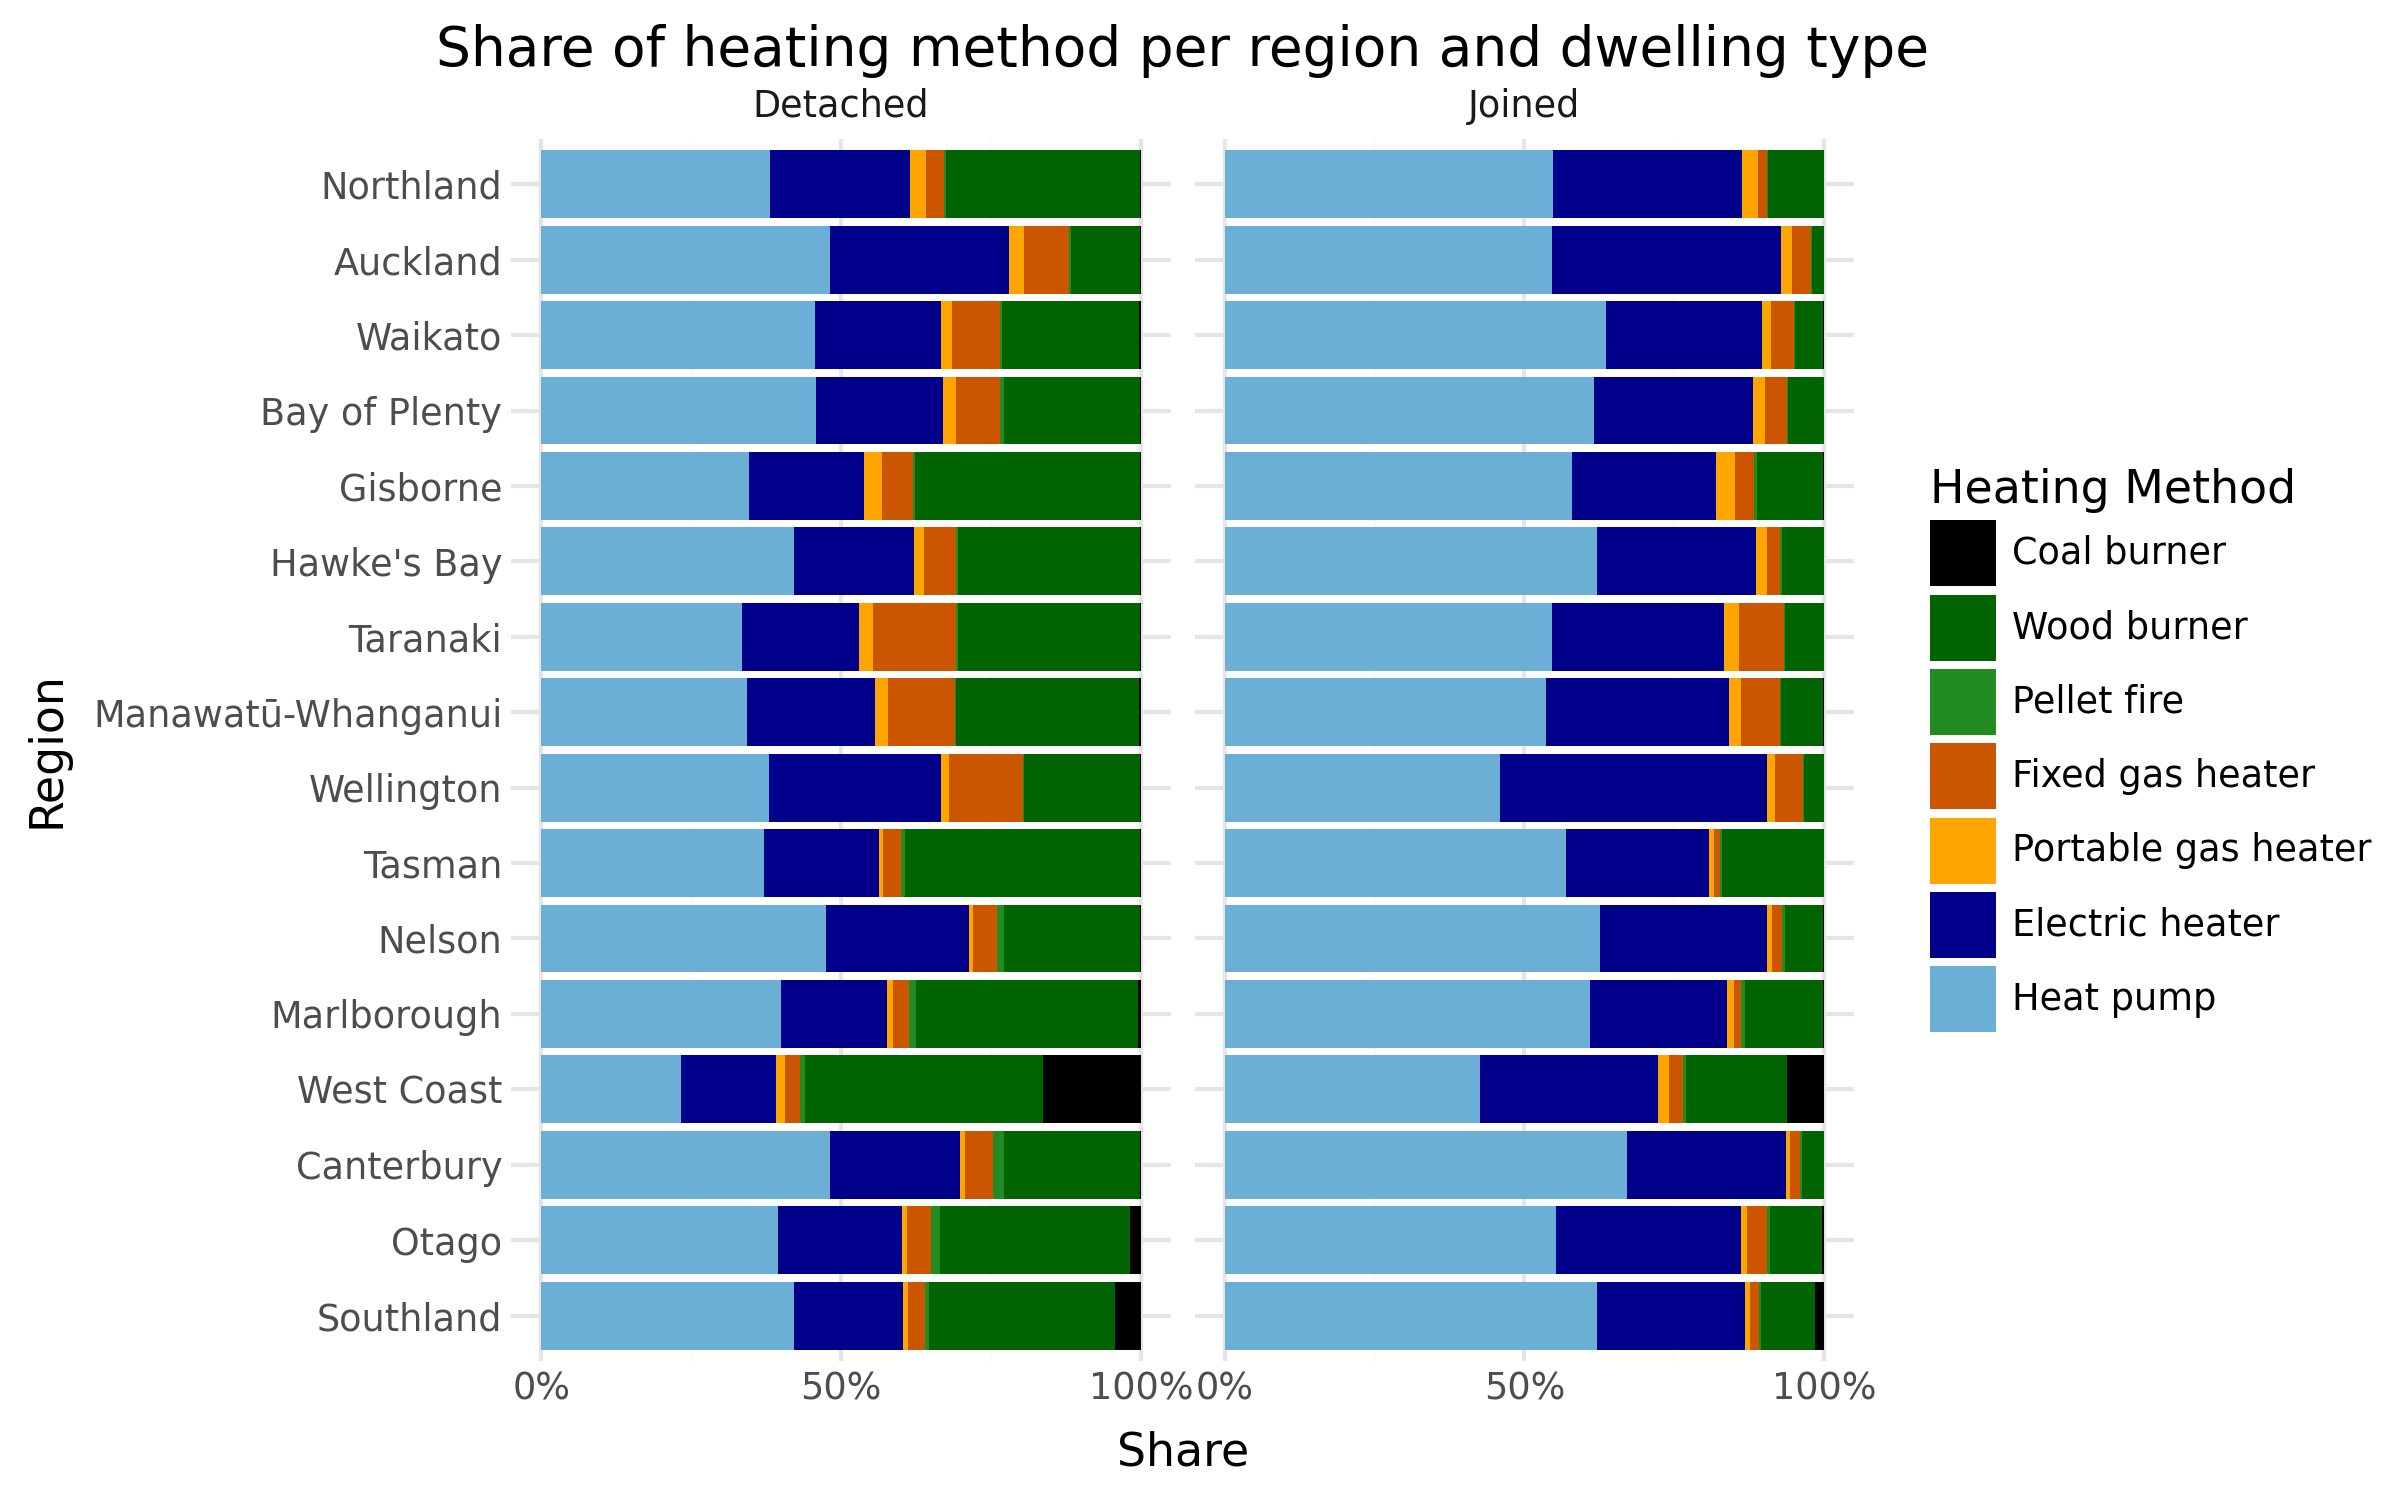
Fig. 1 Heating methods per region and dwelling type#
2.1.3. Step 3: Convert heat demand into fuel demand#
Different heating technologies have different efficiencies, and so the input energy is different across different types. To appropriately disaggregate energy demand, rather than heating service demand, we apply efficiency assumptions for each technology:
Efficiency assumptions used for each heating technology are listed in Table 47.
Technology |
Fuel efficiency |
|---|---|
Coal burner |
55% |
Electric heater |
100% |
Fixed gas heater |
80% |
Heat pump |
375% |
Pellet fire |
75% |
Portable gas heater |
80% |
Wood burner |
65% |
2.1.4. Step 4: Apply modelled fuel demand shares to known residential fuel demand#
We map the census technologies to known EEUD technologies and fuels. We then apply the modelled fuel demand shares to the EEUD results to estimate heat demand by technology, fuel, region, and dwelling type. Results of this exercise are displayed in Fig. 2
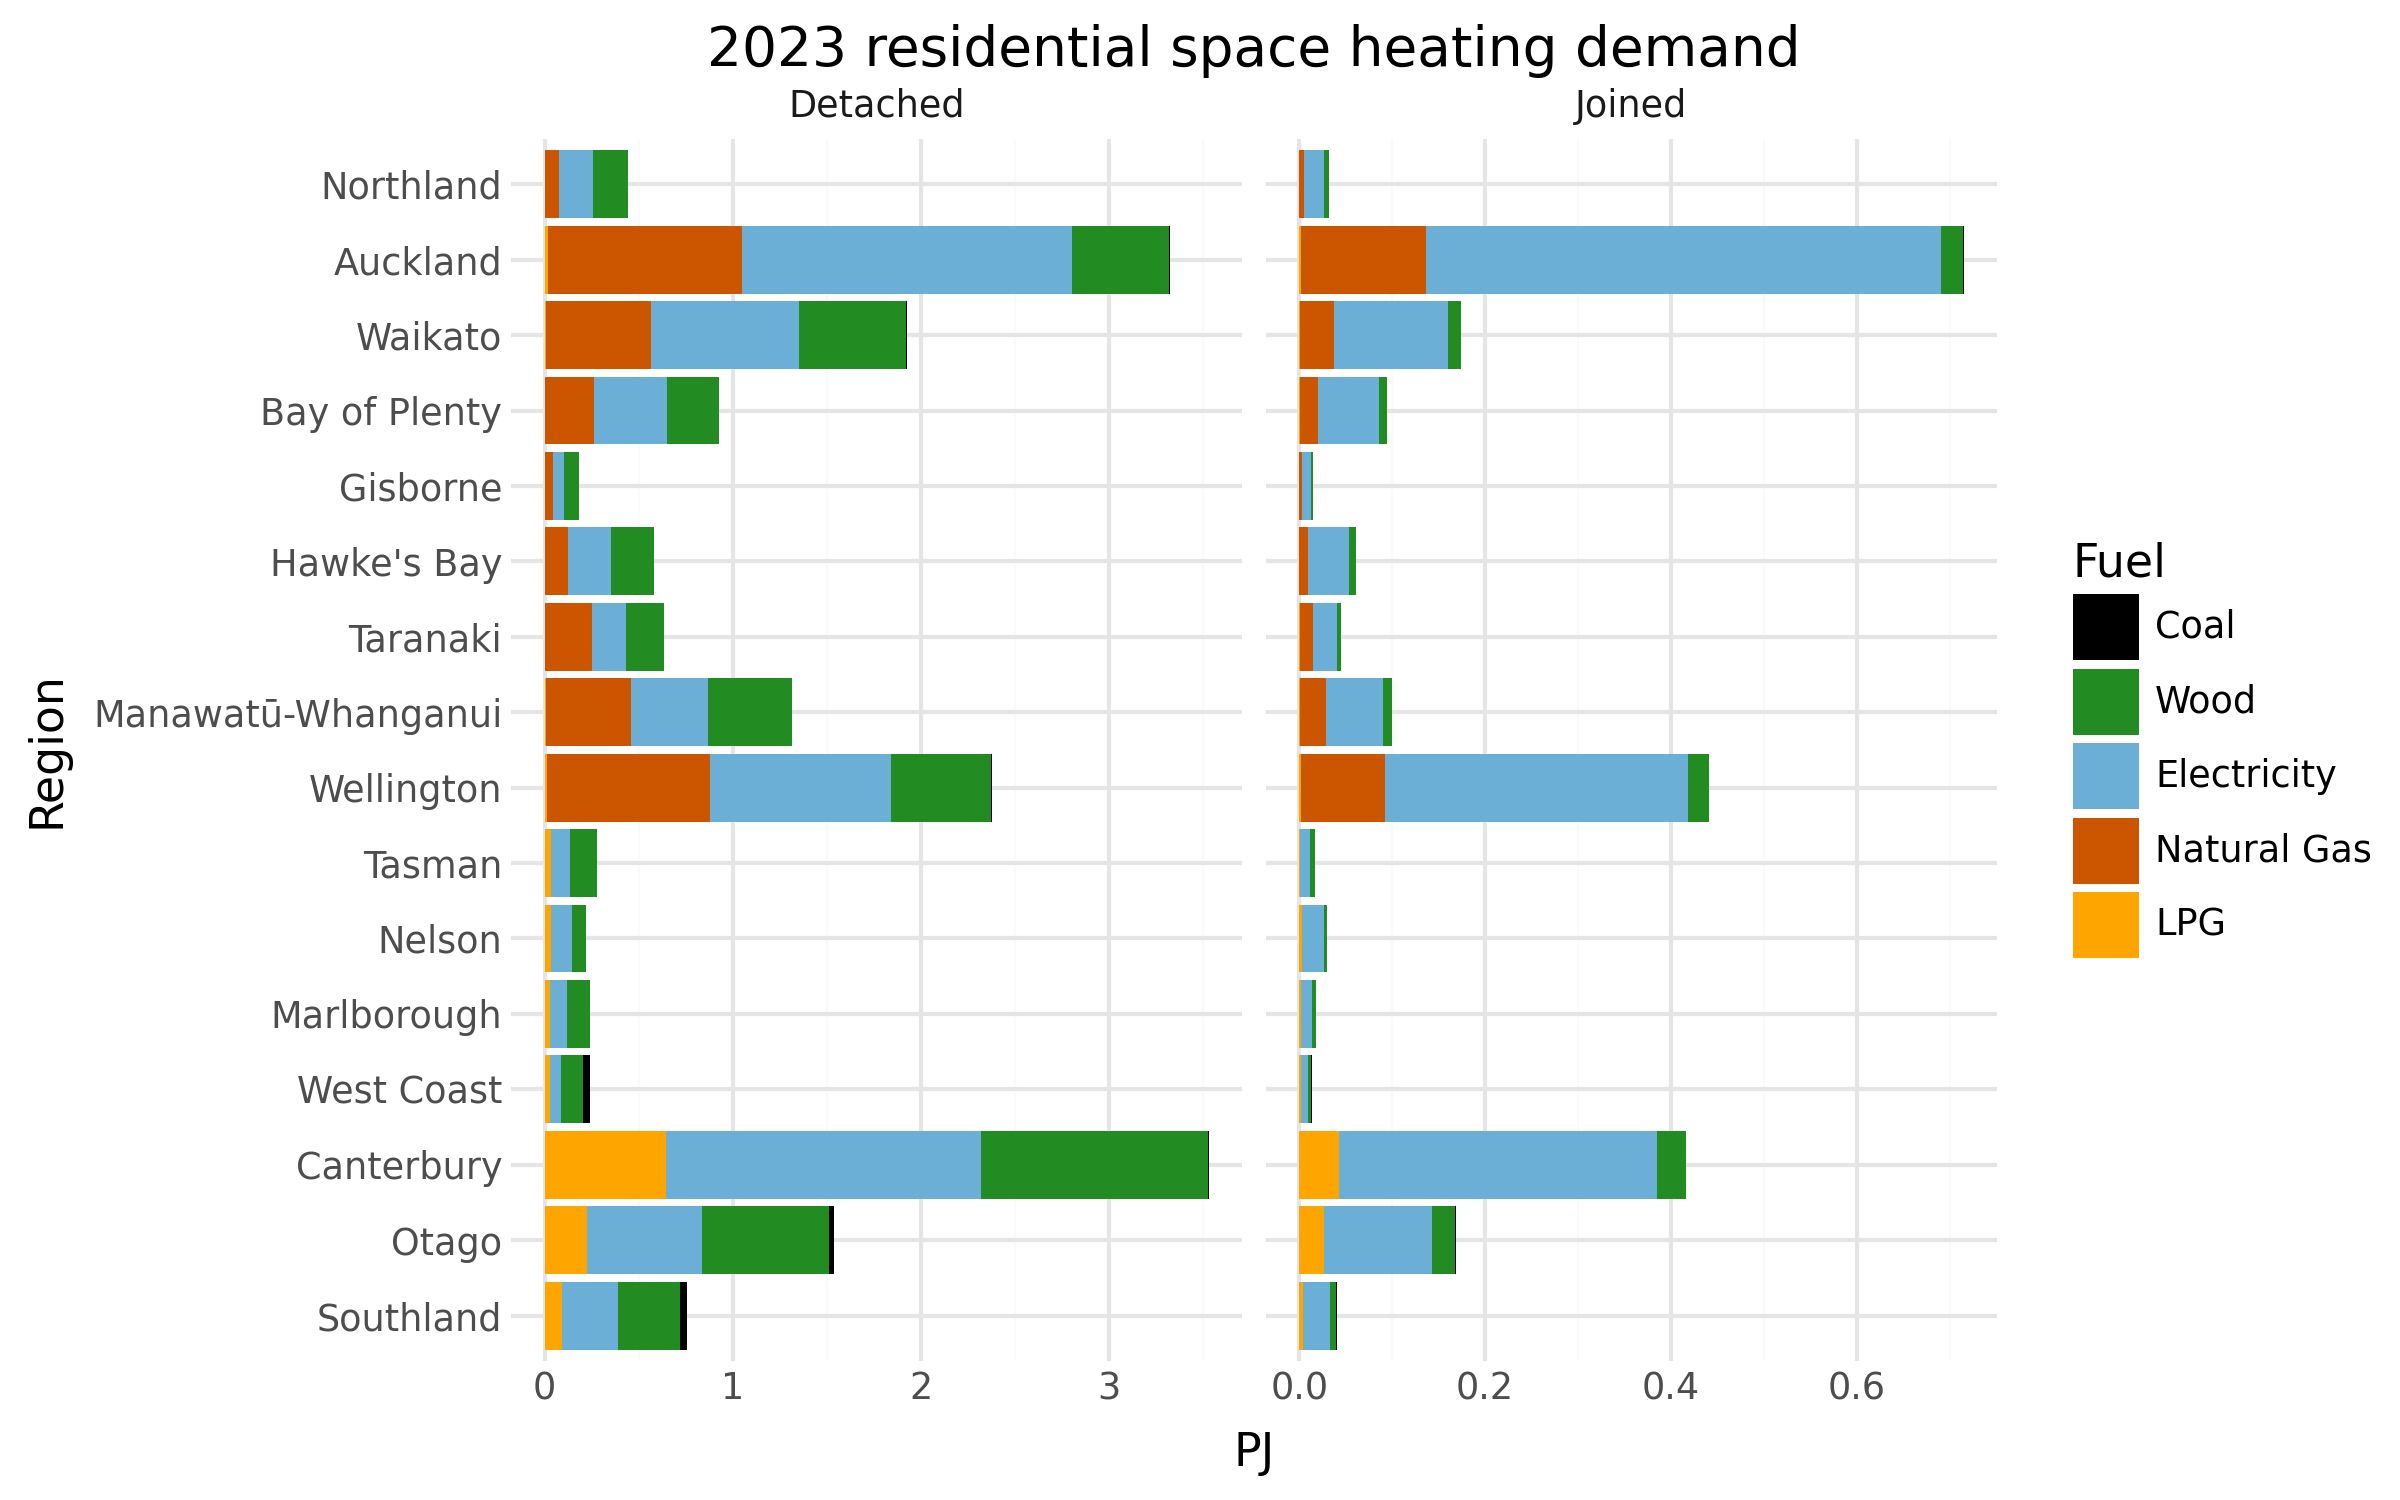
Fig. 2 Estimated regional shares of space heating demand#
Note that total demand for joined dwellings is much lower than for detached dwellings, because standalone houses are much more common than apartments or joined townhouses in all areas of the country.
2.2. Other energy demand#
Other energy demand is disaggregated by population and dwelling type per region, without controlling for temperature. This includes water heating demand, which we assume is mostly driven by population rather than ground temperature.
Again, natural gas use for other end use demand is distributed entirely across the North Island, and demand reallocated for those end uses. This impacts cooking and water heating demand shares.
2.3. Geothermal and solar demand#
The EEUD lists geothermal and direct solar energy use by residences but does not allocate these to specific uses or technologies. We assume that all geothermal residential use is for space heating through ground source heat pumps, and we assume all solar thermal use (which excludes rooftop solar for electricity generation) is used for water heating. Limited information is available on the use of these technologies[5], so we simply distribute the use according to population. The estimated energy values involved are very small.